A recent Nevada Highway 95 trip from Northern Nevada to Southern Nevada, and back, a very familiar route, produced some interesting data. People often make contrary statements about shared fuel economy information, generally well intentioned but not always accurate, including:
1) My similar truck/camper does much better (or worse). 2) An aftermarket engine tune would produce superior results (doubtful but possible). I could write several such hearsay proclamations.
Let us remember that similar is not the same, andthis includes engine tunes, programming, and power ratings. Modifying engine performance is not an option as long as I want to keep my emissions equipment on my truck and continue registering it in the zip code where I live. However, my 350 horsepower, G56 manual truck has plenty of torque and power, and if I wanted more I’d likely regear the differentials.
Now, let’s review some fuel economy 101.
Everything that is different can matter, including:
-Driver
-Tires
-Speed
-Engine output (also brand, configuration, etc.)
-Gearing
-Terrain/conditions
-Weight (less critical than many think, depending on the outfit)
However, the two big ones often not fully appreciated are:
–Engine speed: pumping losses
–Vehicle speed: aerodynamic losses
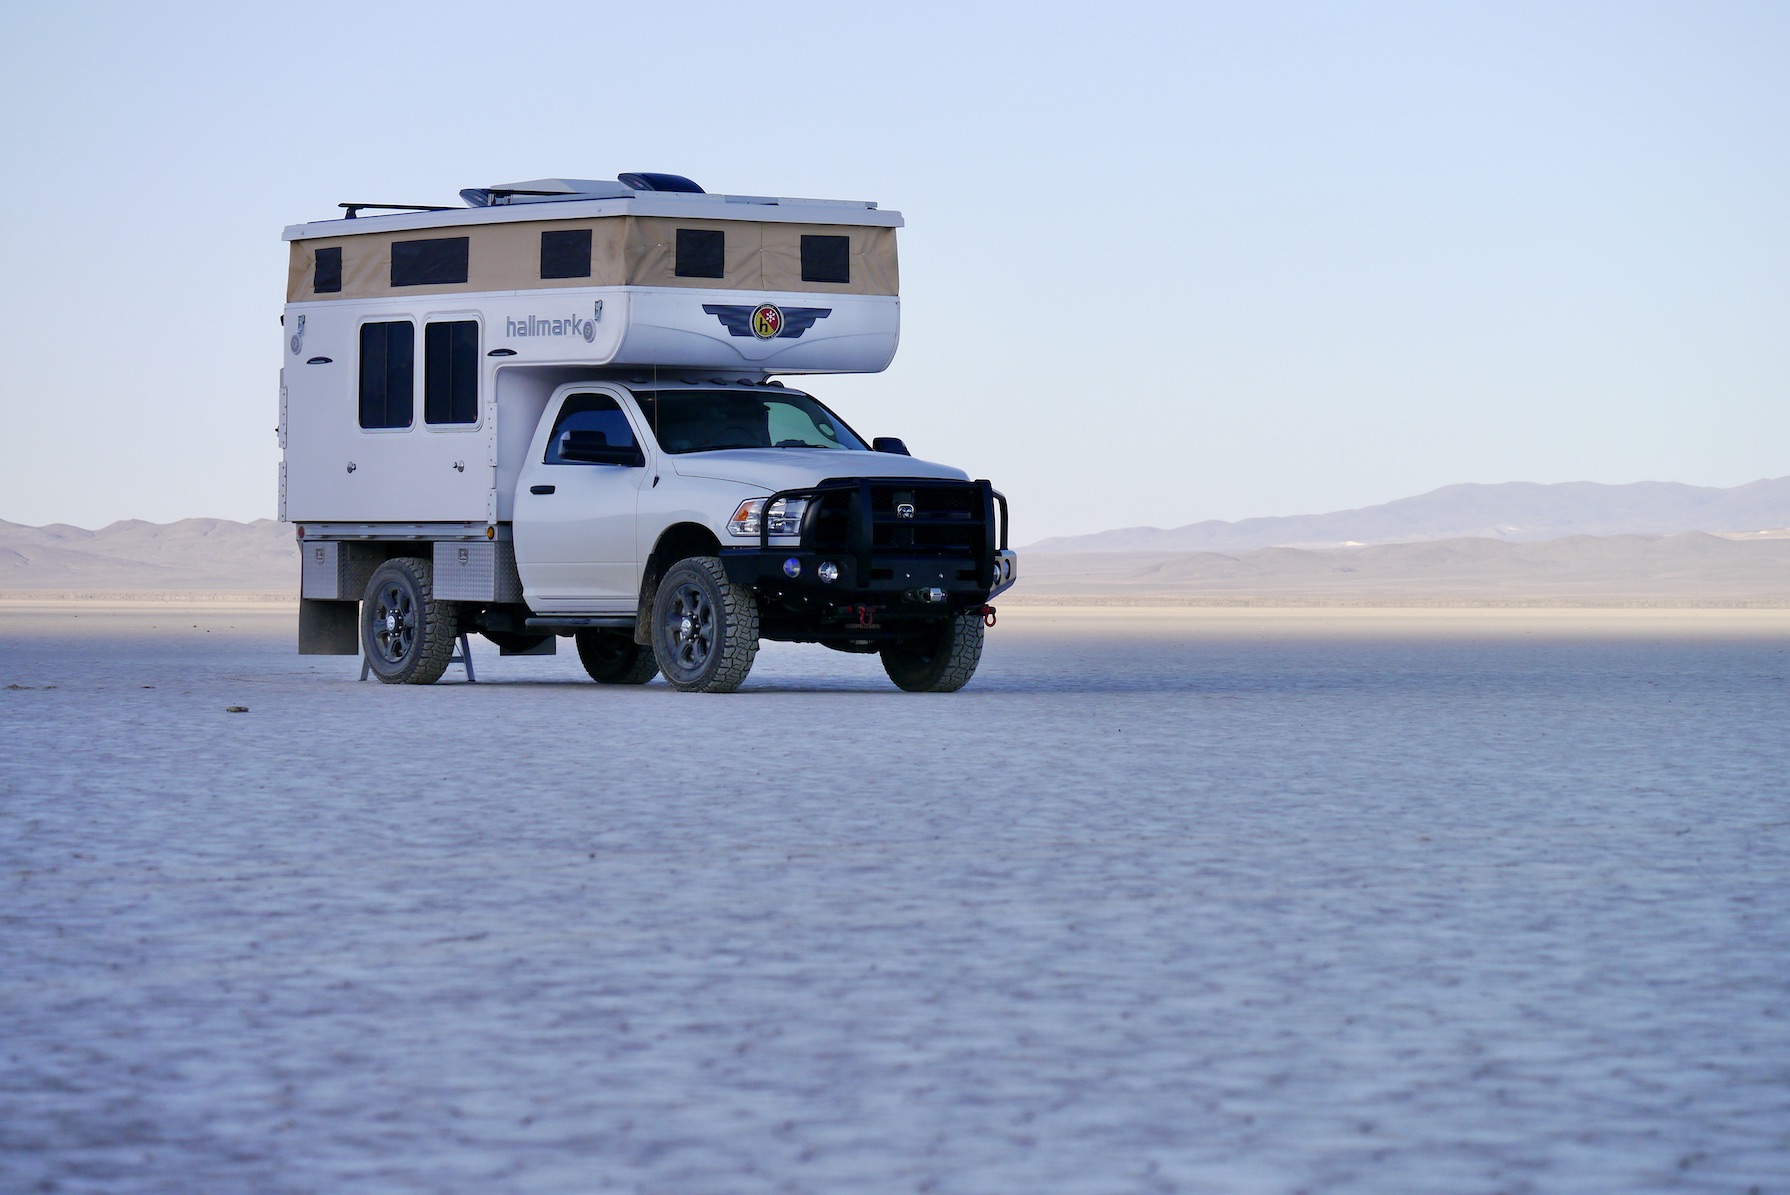
Engine pumping losses are of minimal concern for this rig. The 2017 Ram/Cummins has the tall factory 3.42:1 gears, a 6-speed manual transmission, and runs 35-inch tires, resulting in low rpm in overdrive.
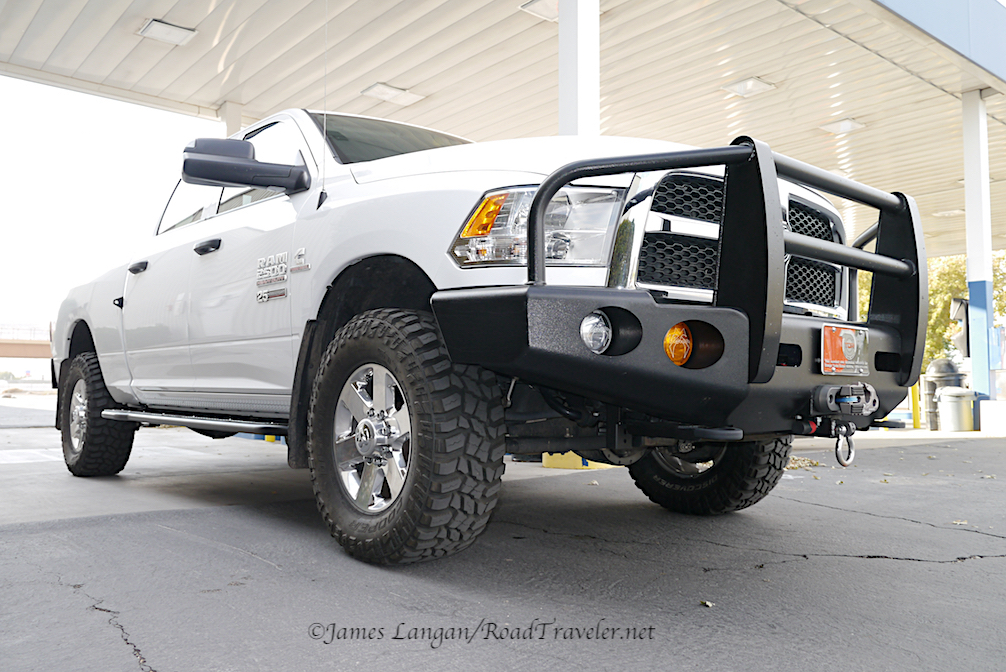
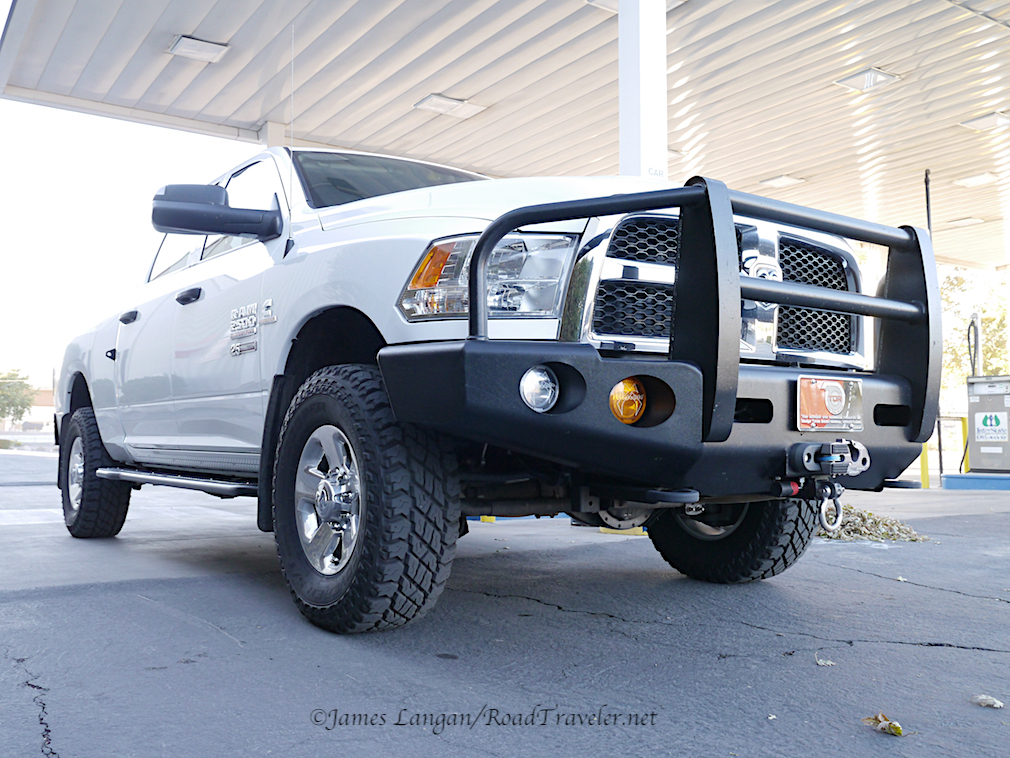
The aerodynamics are horrible. This is a heavy-duty truck with a big winch bumper/grille guard, sliders, and a flatbed with mud flaps; these are important details. However, the frontal area and drag coefficient of the truck camper (and truck) are a huge factors.
It is possible to get similar (or better) mpg with a heavier truck and trailer combination that is more aerodynamic; that’s how critical wind load and speed are.
Fuel Economy Data
The test below was informal, if you want something more detailed, with additional focus on controlling variables, you’ll likely enjoy this post: Tread Matters
Southbound: Fernley to Beatty, Nevada
Vehicle: 2017 Ram 2500 Cummins/6-speed manual
Date: March 2, 2019
Distance: 295.6 miles (odometer corrected)
Cruising speed, where legal: 65 mph
RPM: 1,650
Approx. gross weight: 11,500 pounds
MPG: 13.47
Northbound: Las Vegas to Hawthorne, Nevada
Vehicle: 2017 Ram 2500 Cummins/6-speed manual
Date: March 4, 2019
Distance: 302.0 miles (odometer corrected)
Cruising speed, where legal: 63 mph
RPM: 1,600
Approx. gross weight: 11,500 pounds
MPG: 13.26
Speed Eats MPG
Because the terrain and conditions over Nevada Hiighway 95 have repeatedly given better fuel economy going southbound than northbound, I intentionally reduced my speed going north to try to limit the difference. It worked, two mph made a difference. My educated estimate is that at 65 mph, fuel economy would have been in the high twelves on the trip north, and going as fast a 70 mph would have droped mpg into the mid to low twelves.
Want a quick example of how much speed and conditions matter? The same outfit when it weighed less and was slightly more aerodynamic with the stock front bumper, cruising almost completely at a constant 75 mph on Interstate 80 across Northern Nevada, Elko to Reno, includingmaintaining 75 mph up and over mountain passes, and a bit of off-highway travel to camp, yielded 11.57 mpg over a distance of 300.4 miles. Considering the use and conditions, that was an appropriate result, inline what was requested from the chassis.
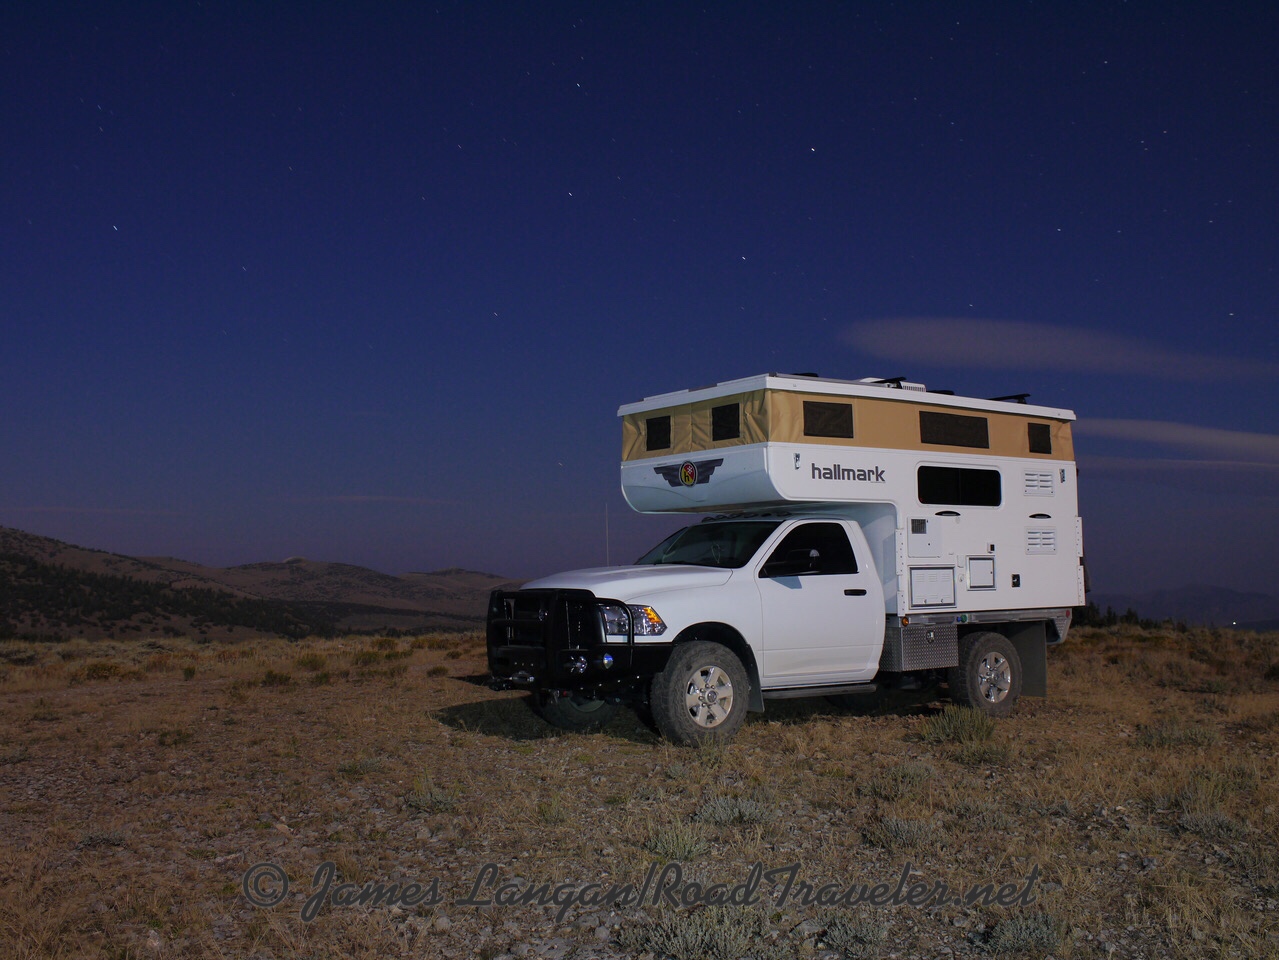
Moosnrise, long exposure, White Pine County, Eastern Nevada, 2018.
James Langan
Copyright James Langan/RoadTraveler All Rights Reserved
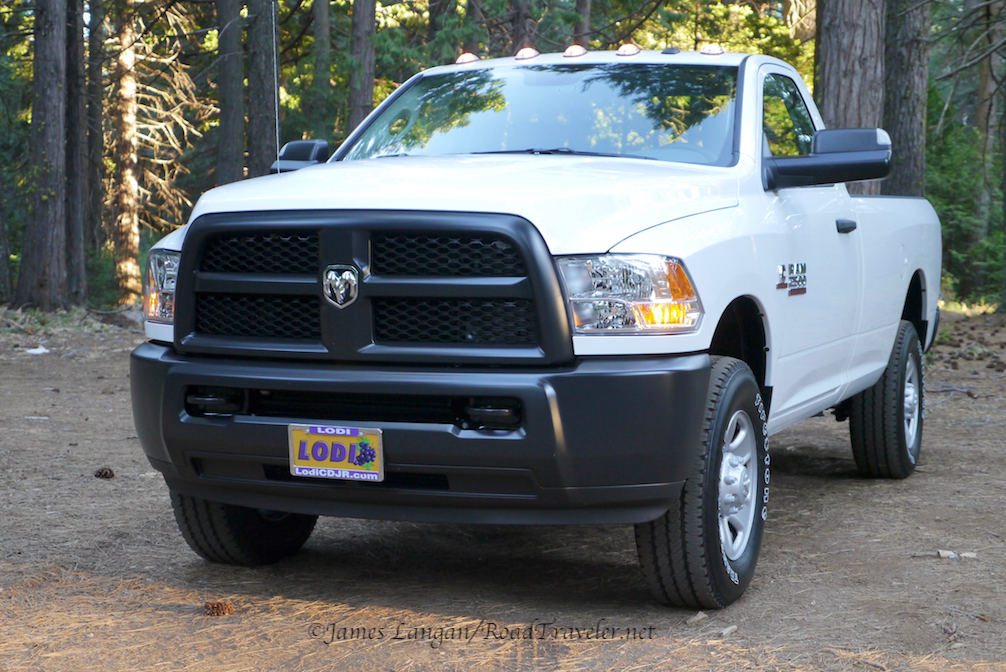
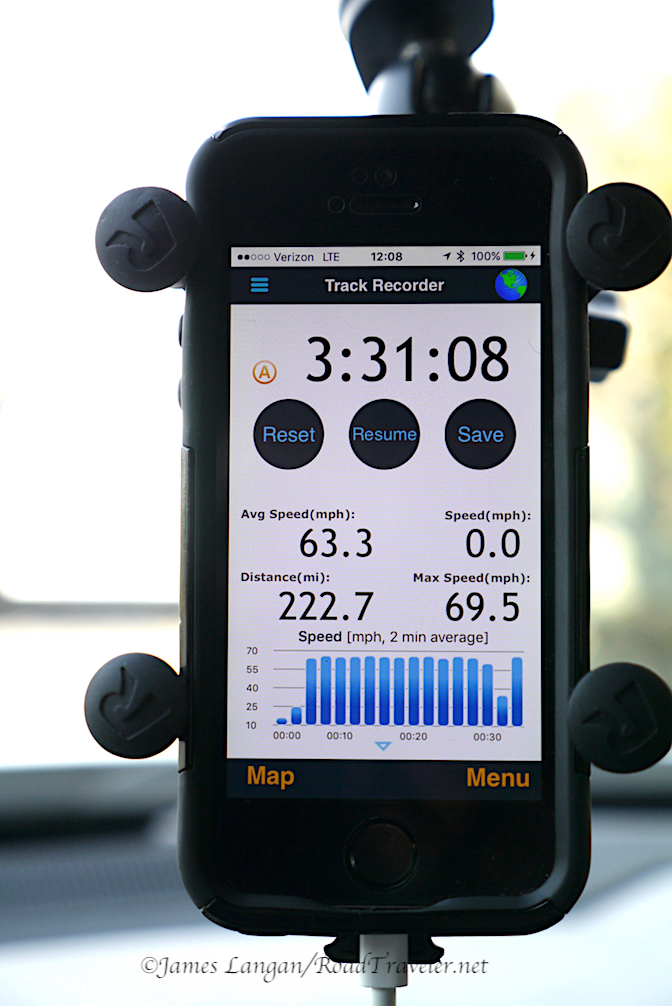
23.21 MPG from a 2017 Ram/Cummins. 65-mph highway baseline test, Sept. 5, 2017
222.7 miles, 9.593 gallons
65-mph freeway/highway test
light/no wind
A/C on
Tires: F 60 R 40 cold
Regular cab, long bed, 7,400-lb. GVW
Newer diesel trucks are not as efficient (due to emissions systems) as previous generations? Maybe. Probably. Though it depends on the exact year, model, and version. The true potential is better than some think, and the conditions, load, and nearly everything else matters.
Tests must be repeatable and confirmable. The ECM was slightly pessimistic here, and the odometer a little fast with the stock tires.
Tires have been a popular subject in magazines for decades, and forums continually see new threads seeking information and expertise. This is partly because they are expensive. They can also provide dramatic style and performance improvements and are an easy upgrade. With so much talk, it is surprisingly difficult to get unbiased, detailed, and authoritative information.
Fuel economy is another perpetually popular topic. Since tire choice affects mpg, or so we have always believed, the subjects are intrinsically linked. Some folks don’t care about mpg, but many care a lot. Except for the purchase of a new(er) truck or major repairs, fuel is our biggest operational expense.
What if it was possible to improve your highway mpg by 5 or 10%? Not a possible increase from the latest magic program pushed by a snake-oil salesman, but simply by choosing a different tread design? An improvement that could be measured and verified, repeatedly, with real world testing, not just theory or laboratory results that are difficult, if not impossible, to replicate.
What Affects MPG?
In the enthusiast truck world it is commonly accepted that bigger rubber reduces miles-per-gallon. Maybe, but bigger is not specific, sometimes it means wider, taller, or both. Taller tires will increase the overall final-drive-ratio, which can help or hurt efficiency depending on the platform and usage.
Previous tests with my 3.42:1-geared, 2014 Ram/Cummins 2500 used for this article indicate that taller meats up to 35” helped economy, or at least hurt mpg less than one might expect when unloaded. Tradeoffs include less torque and slower acceleration from higher final-gearing, though current generation trucks make plenty of torque and horsepower for most reasonable loads. My sense is that stepping-up to 37s would require lower differential gears for optimal performance.
When folks upgrade their tires, particularly on a four-wheel-drive, they often switch to a higher-void pattern; sometimes the more aggressive tread is chosen simply for looks. Even if we don’t mind the road noise or faster wear of an aggressive pattern, how much fuel does looking cool consume if one rarely or never drives off-road? With multiple, simultaneous changes, it’s impossible to say what caused a reduction in fuel economy. Instead of belaboring what modifications can do to our trucks, or what affects what, I’ll briefly quote myself, “Modifications lead to modifications.”
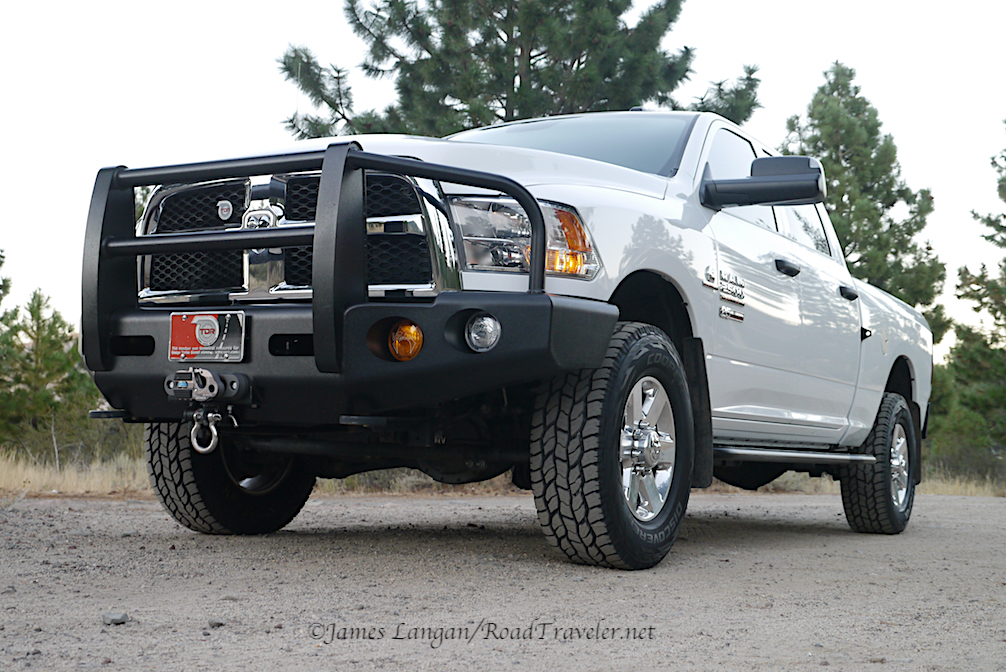
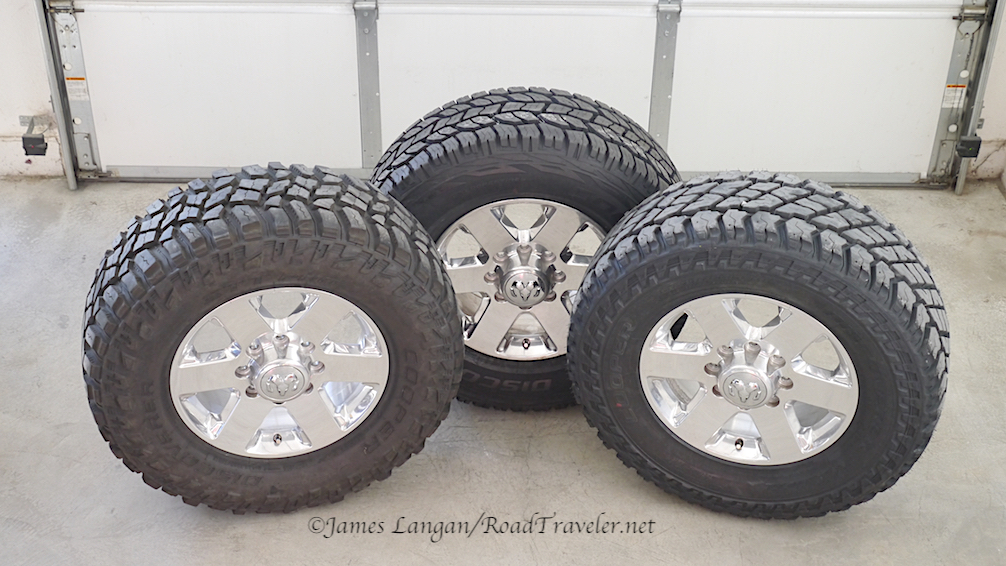
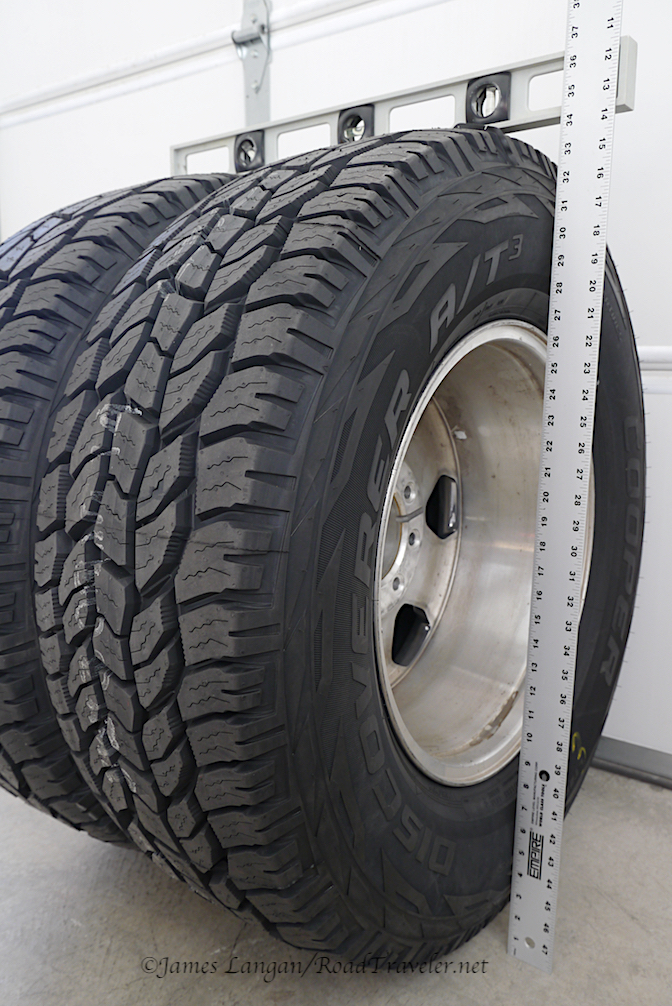
Beefier tires might cost you more mpg than you think.Three great tread choices depending on your priorities.
Controlling Variables With Cooper Discoverer Tires
With generous support from Cooper Tires, I performed a series of real-world tests to document how tread design (or pattern) or tread width impacts fuel economy. I invested a substantial amount of time and money to prove or disprove commonly accepted hearsay and to produce solid data I could not find anywhere. The pattern design tests are complete, and my procedures are detailed below together with the results in Table Two. The width results are concerning, or at least surprising, and additional work may be necessary to become comfortable with the facts.
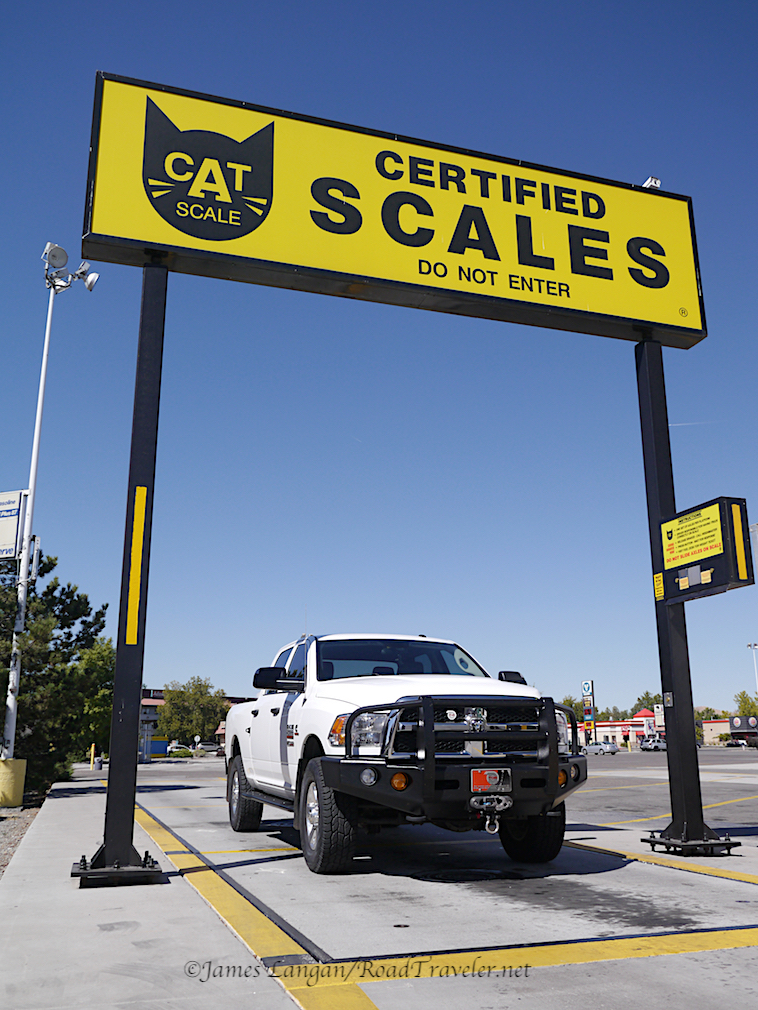
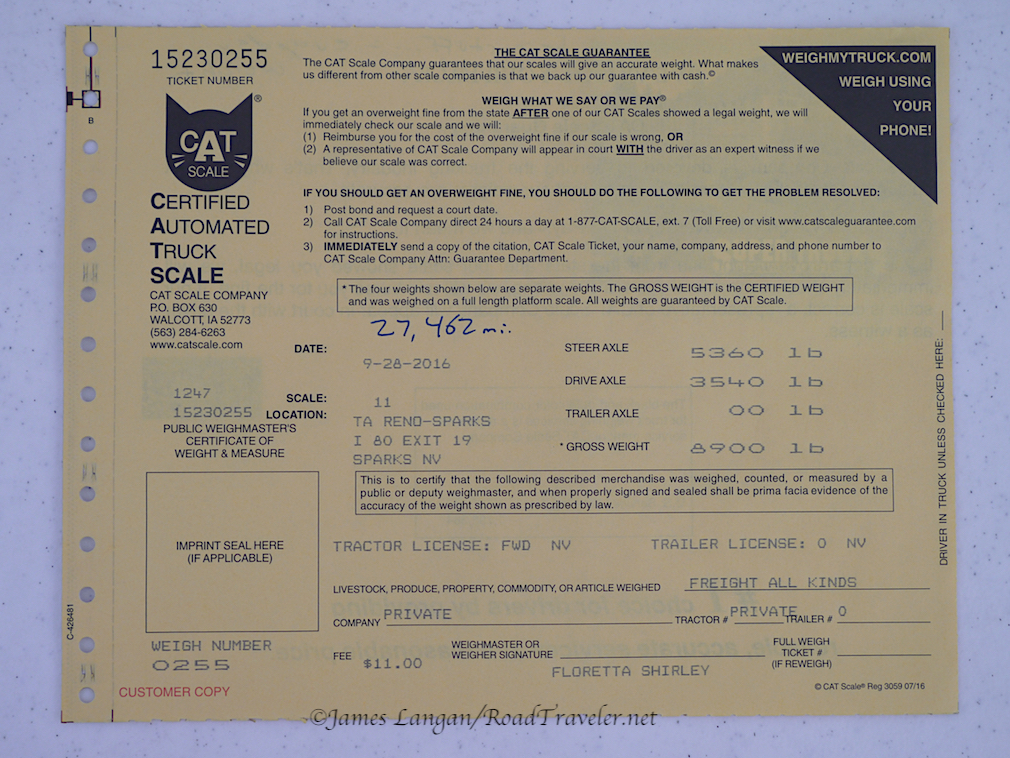
Worth $11.Love knowing what it really weighs.
The primary variable to be controlled for the design test was the size, but weights, odometer and speedometer error, wind, and temperatures were also logged. The bullet list below offers details.
Weather forecasts were monitored until several similar days were on the horizon. Because wind is common in Nevada, and typically increases with the afternoon temperatures, just one test was performed each morning, avoiding the higher winds and heat that would influence outcomes if I conducted multiple runs each day.
Three used sets of the same 29.8-pound, forged-aluminum (WBJ) Ram Bighorn 18” wheels were purchased from Craigslist, allowing all tires to remain mounted and balanced in case a test needed repeating.
Odometer error was measured for every design using mile-markers (MM) and GPS, as different treads in a certain size are not dimensionally identical. A single, constant-GPS distance was used for all mpg calculations. Road speed was monitored with GPS and corrected speedometer measurements.
To reduce the possibly of substantial inaccuracies during fueling, and to increase the validity of the data, the roundtrip route distance was 222.7-miles, over mostly level freeway.
Refueling was done at a particular pump, on the slowest fill rate to prevent foaming, and never topped-off. The freeway onramp is just one mile and three stoplights from the filling station.
Appropriate, not maximum, pressures were used for the modified but unloaded truck- 8,900-pound GVW.
The tailgate was up and the A/C was on.
Cruise control was used and only adjusted or turned-off briefly when absolutely necessary, and notes were logged regarding any irregularities. If an accident, construction, or other mishap would have caused stopping or a substantial speed adjustment for an extended distance, I would have aborted and repeated the test.
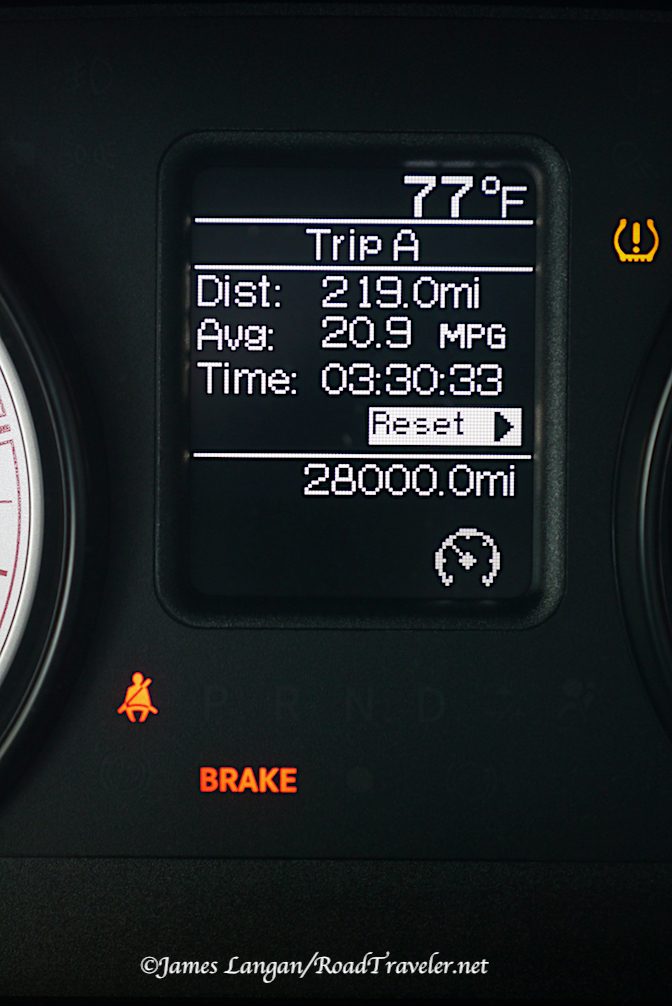
Same GPS distance used for all runs.EVIC mpg info is often inaccurate, doing the math is better.
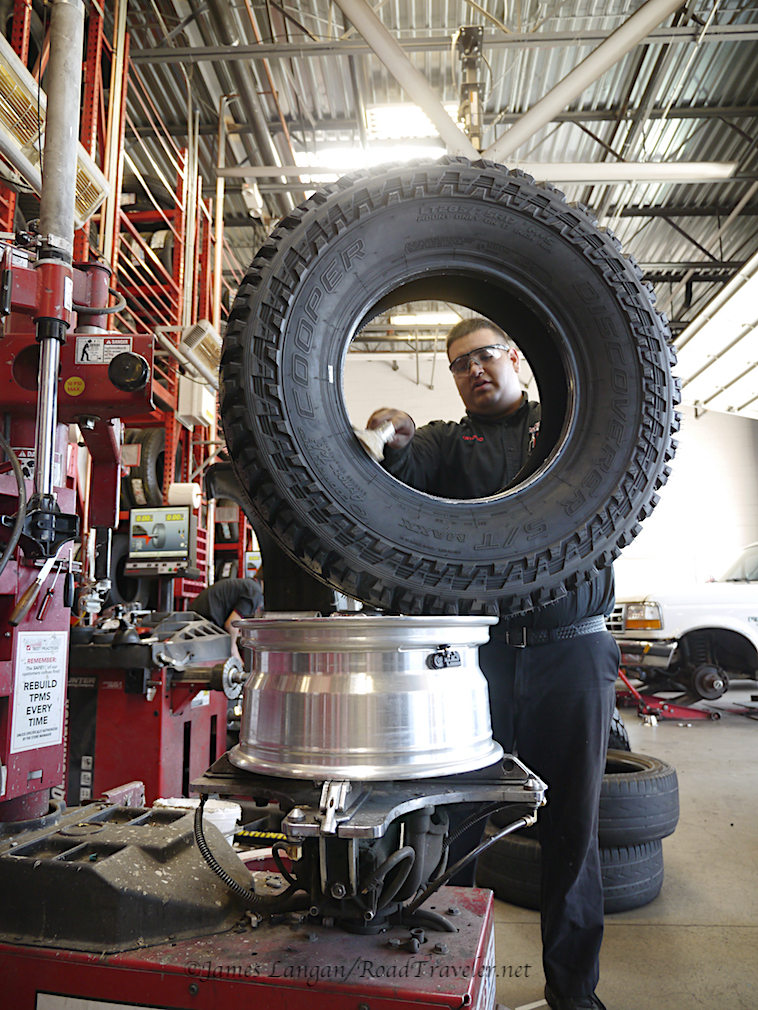
All-Terrain, Commercial Traction, Or Mud-Terrain?
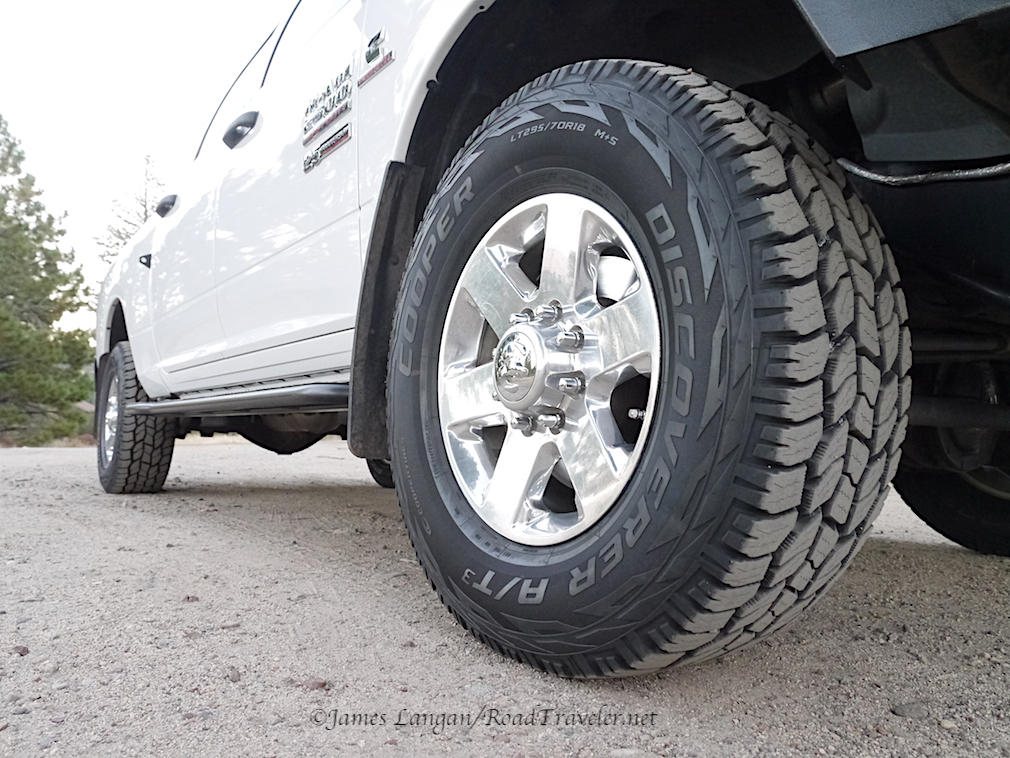
When enthusiasts upgrade their rubber it’s common for choices to fit into one of three categories; all-terrain, commercial traction (hybrid), or mud-terrain. I chose the LT295/70R18E size, which is approximately 34” tall and 12” wide, with an impressive 4,080 pound capacity at 80 psi. Cooper offers three of their popular, yet distinctly different Discoverer patterns in this size: the Discoverer A/T3, Discoverer S/T MAXX, and Discoverer STT PRO.
Readers should remember than although every effort was made to limit variables, these were real-world tests using off-the-shelf products; some differences naturally exist. One easily overlooked fact is that tire compounds are proprietary, and each has its own special cocktail. Tread depth, and sidewall and tread plies also vary depending on the terrain and audience targeted. So the differences affecting performance and mpg are not just the visible patterns, but they include the compounds and the overall construction of each tire.
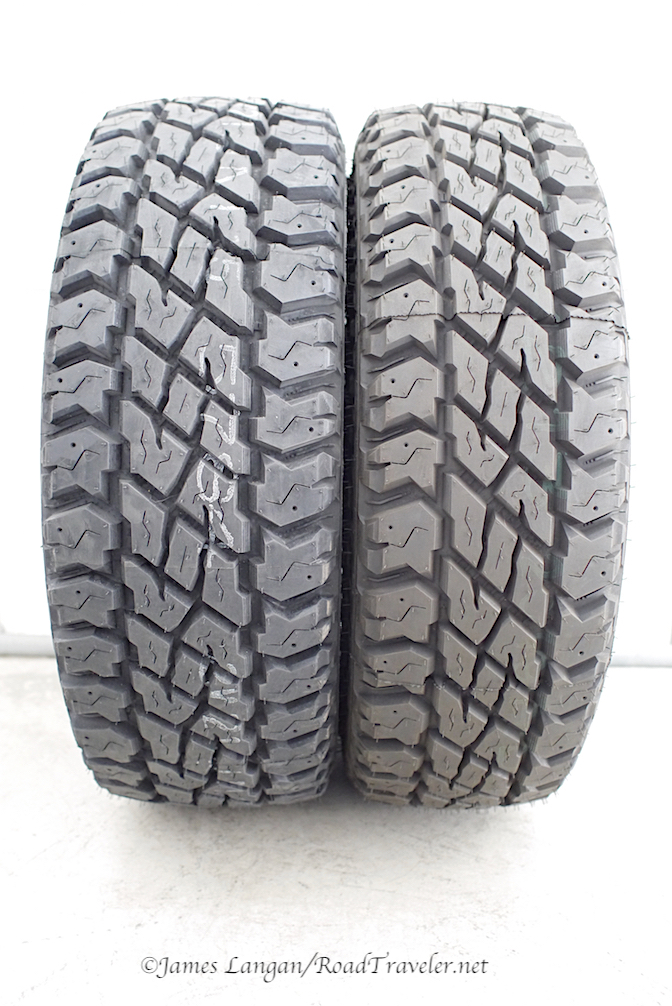
Cooper A/T3, S/T MAXX, and STT PRO designs.
Discoverer 295/70R18E Measurements
The differences between tires of a particular size are often small, though one should be careful when comparing those from different manufacturers and/or a vastly different pattern. Over the past decade I’ve evaluated several sets of Cooper-branded and Cooper-manufactured tires, and my measured values have repeatedly matched the published specifications. Occasional, slight variations appear to be from measuring tools, mounting on narrower rims, etc. Manufactures know precisely what they are producing; they want to be as accurate as possible. Careful measurements were made of each Cooper design, and the details are in Table One.
Reading forums leads me to believe that some consumers don’t measure accurately, and/or expect the on-vehicle dimensions to be identical as the wheel-mounted, off-vehicle measurements; these folks cry foul when they are not. That is silly, as the weight of the vehicle, psi, and wheel width all affect the on-vehicle stature, and this is something the manufactures have no control over.
If you read carefully, and do some math, you may notice that the measured weight of a solo tire, plus the 29.8-pound wheel, does not match the mounted data, there are a few extra pounds in the sums. I’ve seen this many times before, as measuring bare wheels is difficult, and generally I must hold them against my chest and subtract my body weight. The figures listed in table one are what my shop scale, a good bathroom scale, indicated, plenty accurate for weighing heavy auto parts. Emphasis should be placed on the mounted weights, as nobody drives on wheels without tires. The few pound difference between these designs is negligible on a heavy-duty truck with prodigious torque and weighing nearly 9,000 pounds.
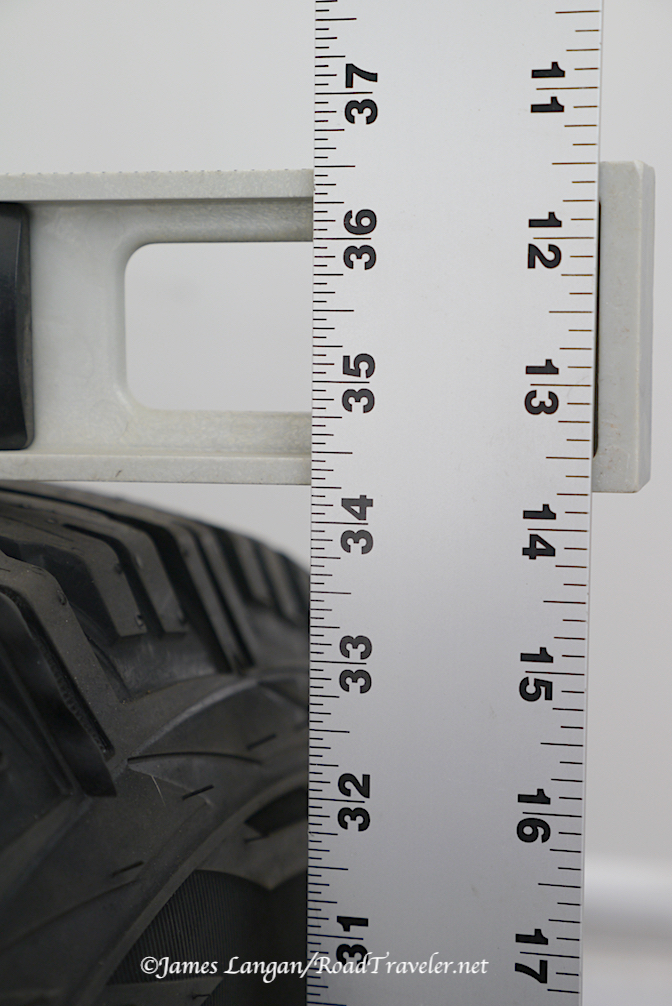
All 295/70R18 tread designs were about 34.25” tall.Straight edge, a rule, and a keen eye were used to record height and width.
Table One, 295/70R18 Measurements
Cooper Discoverer 295/70R18
A/T 3
S/T MAXX
STT PRO
Weight (pounds)
60.2
66.4
68.8
Weight mounted (pounds)
92.0
97.4
99.8
Height unmounted
33 11/16”
33 13/16”
34”
Height mounted @60
34 4/16”
34 5/16”
34 5/16”
Tread width
9 7/16”
9 10/16”
10 3/16”
Tread depth
17/32”
18.5/32”
21/32”
Table Two, Tread Affecting MPG Test Data
Tread Matters MPG 295/70R18
A/T3
S/T MAXX
STT PRO
Test GVW (pounds)
8,900
8,900
8,900
Tire PSI F/R
60/40
60/40
60/40
Date
9-28-16
9-27-16
9-29-16
Time
0832–1202
0859–1230
0837–1208
Temperatures F
54-59-72-70-76-72
52-58-67-73-75-78
58-60-56-69-79-76
Wind/Gusts
1/2-5/5-2/5-4/4-1/2
4/4-2/3-0/0-1/2-0/0
0/0-3/4-5/6-3/8-0/0
Odometer
27,241–27,459
26,950–27,168
27,503–27,721
Trip Odometer
217.6
217.7
217.5
Odo error % MM & GPS
2.24/2.34
2.17/2.29
2.28/2.39
GPS (miles)
222.7
222.7
222.7
MPH indicated
64
64
64
MPH GPS
65.0–65.5
65.0–65.5
65.0–65.5
RPM Tach/Edge Insight
1,700/1,677
1,700/1,680
1,700/1,677
Fuel used (gallons)
10.380
11.033
11.533
ECM indicated MPG
23.2
22.4
21.0
MPG calculated
21.45
20.18
19.30
The less aggressive Cooper A/T3 delivered much better mpg.
Tread Results Commentary
Choosing the Cooper S/T MAXX over the STT PRO mudder offers a 4.6% bump in fuel economy. Running the A/T3 instead of the S/T MAXX delivered a 6.3% increase. The leap from the STT PRO up to the A/T3 is 11.1%. Wow!
It’s impressive that a modified, heavy-duty, 4WD pickup with prodigious capabilities, weighing 8,900 pounds empty, with 34” x 12” tires mounted, can still reach or exceed 20 mpg during highway travel. Obviously most driving involves at least a few and stops and starts, but these repeatable tests demonstrate what is possible if speed and idling are minimized. If I picked the Discoverer A/T3, it appears that long distance highway runs, even with a couple pit stops, could top 20 mpg.
If one needs the extra grip offered by the STT PRO or S/T MAXX, choosing the A/T3 all-terrain might not be an acceptable tradeoff. Yet, if one is so inclined and has the space, these numbers seem to reinforce the practice of having two sets of tires and wheels. Whether they are all-terrains and mudders for your truck, or highway and winter rubber for your car, strong arguments can be made about picking the right tool for the job. We don’t wear flip-flops to go mountain climbing, and our clodhoppers are out of place in a gymnasium.
Off-highway traction is great with a mudder, but you will pay at the pump.
Does Width Matter?
The initial primary platform for measuring how tread width affects mpg was my modified, heavy, and low-geared ‘06 V8 4Runner, because I already had one of two desirable sizes. One might think the results would be relevant for most light-truck platforms. The conditions and procedures were the same as those for the different tread patterns.
I used Cooper’s S/T MAXX in 255/80R17, and 285/75R16, both 33” tall, but the 285s are substantially wider. The 255s are about 10” wide and the 285s about 11.5”; conventional wisdom says the 285s would consume about 1–2 mpg. Without creating another table, the short story is that theses tests delivered ambiguous results, there was very little difference. I was shocked! Followup runs might indicate these results were a fluke, but there were no obviously problems or procedure inconsistencies. The narrower 255s delivered 18.34 mpg, and the 285s 18.22 mpg.
I thought wider treads consumed more fuel, not so sure anymore.On the car or dismounted, the 285s are much wider than 255s.
Ram Width Comparison
Two sets of tires and wheels for my ‘14 Ram partially met the width criteria, meaning they were very similar height with the identical tread pattern, yet the width difference was small. I had them, so test I did, using the same parameters, during the same week, weather conditions, etc.
One set were the 295/70R18 S/T MAXX in table one. The other were 285/75R17 S/T MAXX mounted on 2015 (WFV) forged aluminum Power Wagon wheels, which weigh 28.6 pounds each. These 285mm-wide Discoverers are also 34” tall, but just fractionally shorter than the 295s. The mounted, measured tread width difference between these two sets is only about 3/8”.
The seventeens were evaluated at the end of six consecutive days of testing, and the weather started to change, with 22 mph winds near the end of this last trip. This was noteworthy, but I’d argue that there was not enough wind during most the run to impact the outcome. The data appear to support that opinion. For the slight difference in width, the results appear appropriate. There simply was not enough difference to influence economy, 20.18 vs. 20.22 mpg. I call that a draw.
295/70R18 vs. 285/75R17. Not a huge width difference but still easy to see.Forged 17” Power Wagon wheel on the left, forged 18” Bighorn wheel the right.
Table Three, 285/75R17 Measurements
Cooper Discoverer 285/75R17
S/T MAXX
Weight
64
Weight mounted lb.
93.4
Height unmounted
33 11/16”
Height mounted @60
34”
Tread width
9 1/4”
Tread depth
18.5/32”
Table Four, Ram Width Matters 285/75R17
Width Matters MPG
S/T MAXX 285/75R17
Test GVW lb.
8,900
Tire PSI F/R
60/40
Date
9-30-16
Time
0759–1130
Temperatures F
55-59-69-71-73
Wind/Gusts
0/0-3/4-5/5-5/14-22/22
Odometer
27,780–28,000
Trip Odometer
219.0
Odo error % MM & GPS
1.57/1.68
GPS miles
222.7
MPH indicated
64
MPH GPS
65.2–65.7
RPM Tach/Edge Insight
1,700/1,690
Fuel gallons used
11.011
ECM indicated MPG
20.9
MPG calculated
20.22
Good traction with a tolerable mpg penalty, I prefer a hybrid/commercial traction tires like the Discoverer S/T MAXX.
The Ram results were not a big surprise. The lack of separation between the 4Runner’s width test mpg numbers, and to a lessor extent the Ram’s, have me questioning how much tread width alone impacts fuel economy. Much taller tires, with the corresponding overall gearing changes, combined with more aggressive tread patterns may be the main story behind fuel economy losses when fitting aftermarket rubber. Sometimes testing answers questions.
James Langan
Copyright James Langan/RoadTraveler/Turbo Diesel Register. All Rights Reserved.
A version of this article was also published in the Turbo Diesel Register magazine.
Recently a friend emailed this miles-per-gallon question:
I’m scratching my head here on fuel and mileage numbers. If I do the math for gallons of fuel consumed (fuel filter life % gauge) and odo I get about 16 mpg.
But the Ram’s EVIC dash display says 11 MPG.
With 4.30:1 gears and 37-inch tires, I know ALL the numbers are inaccurate.
How do I figure this out?
My reply:
I’d be very surprised if you are able to routinely obtain 16 mpg with your Ram/Four Wheel Camper setup, unless you are driving 55 mph. I never trust dash displays. They are almost always overly optimistic, though in your case because of the tall, 37-inch tires, it may actually be a little pessimistic. My built, 2006 4Runner mpg display is slightly low most of the time because the car travels further on taller tires than the ECM calculates.
The fuel filter life gauge is not a good source for mpg data, I think it’s really only useful for when to change the fuel filters. I’ve done similar calculations using the oil life percentage numbers (it probably uses the same ECM algorithm) after doing oil changes. The numbers literally do not add-up to the actual odometer distance traveled (neither indicated miles or the known and measured inaccuracy). To state the obvious, the only way to get accurate fuel economy readings is to have good numbers for the math; how many miles vs. how many gallons at fill-up.
I don’t think your gearing change matters. Most late-model vehicles calculate the speed from wheel sensors… as long as that’s the case on the new Ram (easy to test) then it is only the tire diameter that matters. I’ve tested many sets of 33, 34, and 35-inch tires on my 2014, but no 37s yet. My guess is that your odometer is about 8-10% slow, compared to the actual miles you are traveling.
My method of testing tire-induced odometer error is to compare actual miles traveled to odometer readings. California doesn’t use highway mile-markers most places anymore, but Nevada does. With two columns on paper, I reset my trip odometer at a mile-marker, and then log the indicated and mile-marker distances. Data gathered over more miles will be more helpful. For example, a 10-20 mile test can be better than nothing, but the initial error percentage will drop if you make a longer run, like 50-100 miles.
If you’re on a long trip you can use indicated GPS miles instead of mile-markers. Recently I compared GPS to mile-marker data over a 70-mile route, and was surprised that they were just slightly different.
Good luck.
Copyright James Langan/RoadTraveler. All Rights Reserved.
Maybe I’m wrong. Maybe VW’s despicable deceit will hurt the future market for diesel cars in the USA, like GM’s pathetic first attempt to make light-duty automotive diesels decades ago? The action was very different, but could a generally negative public perception of diesel power return? This article argues yes. http://autoweek.com/article/car-news/why-volkswagens-diesel-betrayal-different
The author makes valid points about alternative technologies getting better, heck, even gasoline-powered cars have become extremely efficient and economical (if we buy those models). My guess is that VW’s 2.0L TDI engines could have met the standards, still drive well, while obtaining slightly fewer miles-per-gallon. How much less is the question. Maybe two–three mpg on the highway? If that’s the number was it worth the trouble VW? Would people have avoided purchasing TDI cars because the EPA rating was lower and/or the cars obtained slightly less mpg?
Maybe we will find out if there is an ECM update recall that corrects the programming, making the cars meet standards. If so I’ll likely do a back-to-back freeway fuel-economy test to document the change. When the 2.0L TDI engines conform there might be consequences, like the particulate trap might fill sooner, and the car may not meet emissions system warranty standards set by the EPA.
As a former owner of the 1.9L TDI with its relatively modest 90 horsepower and 155 lb-ft of torque (2000 specs), and a current owner of a 2013, no-DEF injection, 2.0L TDI Jetta Sportwagen that makes an impressive 140 horsepower and 236 lb-ft, the slight reduction in real-world fuel economy from the newer car remains impressive. Both were equipped with manual transmissions, which helps economy, performance, and driving pleasure. The ’13 2.0L has a 6-speed tranny with an extra cog on top, and the taller final-drive ratio lets the engine turn fewer rpm, which surely helps.
If diesel car sales are severely and permanently damaged in the USA because of VW’s actions it will be unfortunate for enthusiasts, the engine design and technology has so much to offer, still. However, even if this does happen I’m confident it will not hurt the diesel truck market. The buyers are generally not the same folks, as the green diesel car market and the impressively powerful (and efficient) full-size light-truck diesels target different customers. Diesel-powered trucks and commercial equipment are going to continue doing work and moving freight for the foreseeable future. Decades.
Last weekend we had the pleasure of attending the 2012 Overland Expo near Flagstaff, Arizona, and spent four nights camping in our new-to-us Four Wheel Camper. To maximize our time at the event and accommodate our work schedules we were forced to drive the full 730 miles to the Overland Expo in just one day. To reduce our time on the road for what was admittedly a very long day of road travelin’, I didn’t pilot the Tundra at my typical, slow-ish highway speed of 65 miles-per-hour.
Road construction en route didn't help our progress.We had a nice view of Walker Lake while we waited for 1/2 hour.
When time is short my fuel economy focus is set aside, and I drive and pass as fast as safely possible. With a 70-75 mph posted speed limit most of the way, keeping a very brisk pace was not difficult. The Tundra’s 5.7L V8 is ready to make copious horsepower when I drop-the-hammer, and I’m not hesitant to use high revolutions-per-minute.
Driving in this manner guarantees that more fuel will be used and frequent fuel stops will be required. With a few exceptions, many new trucks don’t have the kind of long-distance range most would like when towing or hauling long distances. For on-highway hauling or backcountry exploring, most trucks with anything less than 30 gallons of fuel capacity (minimum) have a noticeably limited range. More efficient diesels with large factory fuel tanks are often better, but still lacking when serious work is being performed.
Our brisk pace.
Gas Pump Rant
Stops for fuel (and often a head call) typically take 20 minutes, add-up quickly, and when combined with lunch and/or dinner breaks really contribute to length of the travel day. Added to this in this age of $4+ fuel is the frustration that many filling stations still have pumps that shut off at $75. I love pay-at-the-pump, it’s very convenient and shortens the length of fuel stops. However, a few times on this trip our gas tank was not quite full once the $75 threshold was hit after less than 20 gallons. Because I don’t want to leave a fuel stop with anything less than a full tank, and calculate the fuel economy of each fill-up, I was forced to slide my credit card a second time for what was often very little fuel to top-off. Ridiculous.
Several months ago many gas stations increased their maximum single purchase to $100, a better number for sure, but still not much extra at our current fuel prices. If I ever add a larger tank, at least the second (or third) card wipe will add adding many gallons, not just a few.
Fuel Economy and Range
With the relatively poor fuel economy of light-trucks loaded and traveling fast, particularly gasoline-powered, there is a notable trade-off when exchanging fuel economy for speed.
In the case of this fast-moving 5.7L Tundra, if we had been able to reduce our speed and achieve 13 mpg instead of the 11 mpg we often saw, we would have added 40 miles to each 20 gallon fill-up, a substantial increase in range in exchange for time.
Whether we are running slowly and light or fast and heavy, I wish new trucks came with more fuel capacity, much more. While I’m not opposed to carrying cans of fuel, when traveling mostly on-highway it simply makes sense to stop more often and buy gas for the OE tank at a filling station. Thirty+ gallons of fuel capacity please, more would be better, or substantially increase the fuel efficiency. Either way increased driving range would be the result and is surely needed for those who use trucks as trucks.
Driving in the wind can be a drag, particularly if you’re driving a high-profile vehicle, hauling a camper, or pulling a trailer. We live in an area that often has wind, and unless it’s coming directly from the rear, wind is an impediment to good fuel economy.
Don't Hit The Farmer
A perfect, direct tailwind is like the perfect anything, nice to dream about but difficult to find and enjoy. In the real world roads twist and turn, and wind swirls and comes from multiple directions. If you’re on a one-way trip with a direct tailwind, embrace and enjoy the smooth ride.
Watch Out For Semi Trucks
Strong headwinds are of course the worst, but lateral winds also inhibit forward progress and add to the always-present aerodynamic drag that increases with speed and reduces miles-per-gallon. Ascending hills consumes fuel, particularly if we insist on charging them at full-speed, but driving in strong winds can be like constantly driving up a grade. Of course it’s not just wind that reduces fuel economy, other weather conditions can be a drag too, heavy rain, snow & slush…
It Takes More Than a Breeze To Make Clouds Like These
Heavy Wind MPG Impact
Over the past month two lightly loaded trips to pickup and deliver cargo reinforced the impact wind can have on highway fuel economy. Though not to the same destinations or on the same highways, the distances were very similar, and both trips were mostly on rural highways with which I am very familiar. Both trips included a few minor passes and grades, though I would not call the routes mountainous, relatively level for around here. In my mind, the first trip should have produced better fuel economy, though both were through areas that are often windy, and during trip one it was extremely windy. On both tests my top speed was the same 65 miles-per-hour, though the second test did include some two-lane highway with a lower limit for several miles, mostly 60, which improves fuel economy. There were very few stops and starts.
The Return Trip
Test Vehicle: 2011 Toyota Tundra, lifted with Old Man Emu suspension, 2-inches in the rear, 3.75-inches in the front, LT285/70R17D Dick Cepek F-C II tires, tailgate removed.
Trip 1: Reno, Nevada, to Susanville, California, via U.S. Route 395.
181.2 miles / 11.142 gallons of unleaded = 16.26 mpg.
Trip 2: Reno, Nevada, to Mason, Nevada, via I80, U.S. Route 95 ALT.
172.1 miles / 9.979 gallons = 17.24 mpg.
The mpg trip computer in this Tundra has proven quite accurate much of the time, though when the second test was completed the PCM was pessimistic, indicating 16.9 mpg. We always calculate and record our true mpg, and compare it to the PCM’s readings. The math doesn’t lie, but liars do math. Speaking of liars…